Total claimant number for

October 2012 in each

parliamentary constituency

and +/- percentage

compared to October 2011


N=North London    E=East   

S=South     W=West     C=Central


Source: Government statistics


Barking (E)

4,714 claimants  -0.3% on October 2011


Battersea (W)

2,537  +0.1


Beckenham (S)

1,115  -0.2


Bermondsey and Old Southwark (S)

4,500  -0.1


Bethnal Green and Bow (E)

5,548  -0.4


Bexleyheath and Crayford (SE)

1,753  -0.3


Brent Central (NW)

5,744  +0.1


Brent North

2,569  +0.1


Brentford and Isleworth (W)

2,249  -0.2


Bromley and Chislehurst (SE)

1,786  +0.1


Camberwell and Peckham (S)

5,615  -0.4


Carshalton and Wallington (S)

2,041  0


Chelsea and Fulham (SW)

1,699   -0.4


Chingford and Woodford Green (NE)

2,119    -0.4


Chipping Barnet (N)

2,110    -0.3


Cities of London and Westminster (C)

2,025    -0.1


Croydon Central (S)

3,169    -0.4


Croydon North

5,057    -0.3


Croydon South

2,072    0


Dagenham and Rainham (E)

3,501    -0.3


Dulwich and West Norwood (S)

4,045    -0.3


Ealing Central and Acton (W)

2,900    -0.2


Ealing North

2,969    -0.4


Ealing Southall

2,832    -0.3


East Ham (E)

5,009    -0.3


Edmonton (N)

4,699    -0.3


Eltham (SE)

2,331    -0.1


Enfield North (N)

3,438    -0.3


Enfield Southgate

2,014    -0.4


Erith and Thamesmead (SE)

3,479    -0.1


Feltham and Heston (W)

2,719    -0.3


Finchley and Golders Green (N)

2,211        0


Greenwich and Woolwich (SE)

3,682    -0.1


Hackney North and Stoke Newington (E)

4,701    -0.5


Hackney South and Shoreditch

5,508    -0.8


Hammersmith (W)

3,612    -0.3


Hampstead and Kilburn (N)

3,272    -0.1


Harrow East(NW)

1,729    0


Harrow West

1,985    -0.3


Hayes and Harlington (W)

2,719    -0.1


Hendon (NW)

2,597    -0.1


Holborn and St Pancras (C)

3,569    -0.3


Hornchurch and Upminster(E)

2,248    +0.1


Hornsey and Wood Green (N)

3,465    -0.7


Ilford North (NE)

2,192    -0.4


Ilford South

3,928    -0.4


Islington North (N)

3,754    -0.2


Islington South and Finsbury

3,167       -0.3


Kensington   (C)

2,530    -0.3


Kingston and Surbiton (SW)

1,560    0
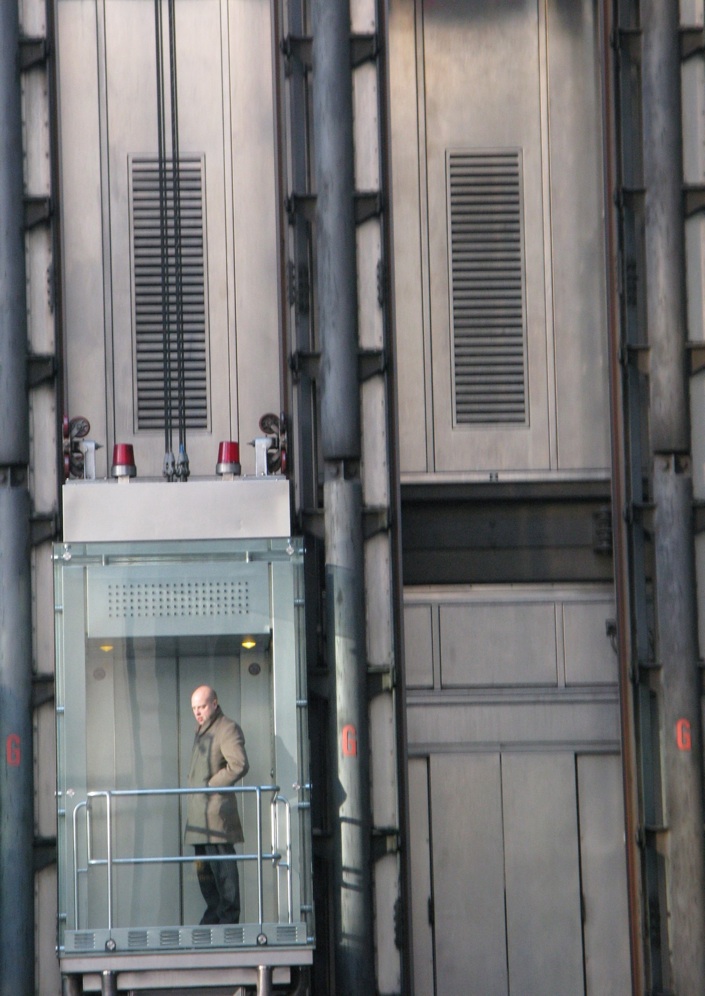
    Words & Photos  © Paul Coleman LONDON INTELLIGENCE 2012

Unemployment Benefit Claimants in London


Some 8.7% of Londoners (aged 16-64) were out of work in Q3 2012. 224,801 people across London claimed unemployment benefit - Jobseekers Allowance - in October 2012, a marginal fall of 0.2% compared to October 2011.

   Most parliamentary constituencies recorded similar falls. The biggest falls of 0.5% and 0.8% came in two east London constituencies in Hackney.

   But no causal link was made to the expansion in Hackney’s Shoreditch/Hoxton area of ‘Tech City‘ - a cluster of new and established creative and media enterprises. Both constituencies sit next to the Olympic Park in neighbouring Stratford where many temporary jobs were created to deliver the Games.

    HOME     WORK      CRISIS      ECONOMY      REGENERATION      STREETS

Lewisham East (SE)

3,535    -0.2


Lewisham West and Penge

3,662    0.2


Lewisham, Deptford

4,506    0


Leyton and Wanstead (NE)

3,423    -0.5


Mitcham and Morden (S)

2,838    -0.1


Old Bexley and Sidcup (SE)

1,149    -0.1


Orpington (SE)

1,334    -0.1


Poplar and Limehouse (E)

5,403    -0.2


Putney (W)

1,602    -0.1


Richmond Park (SW)

1,161    -0.1


Romford(E)

2,141    -0.1


Ruislip, Northwood and Pinner (NW)

985    -0.1


Streatham (S)

4,105    -0.3


Sutton and Cheam (S)

1,374    -0.1


Tooting (S)

2,276    -0.2


Tottenham (N)

6,335    -0.3

Twickenham (SW)

1,240    -0.1


Uxbridge and South Ruislip(W)

1,629    -0.2


Vauxhall(S)

4,5090


Walthamstow (NW)

4,633    -0.4


West Ham (E)

6,412    -0.3


Westminster North (C)

2,902    -0.4


Wimbledon (S)

1,040    0